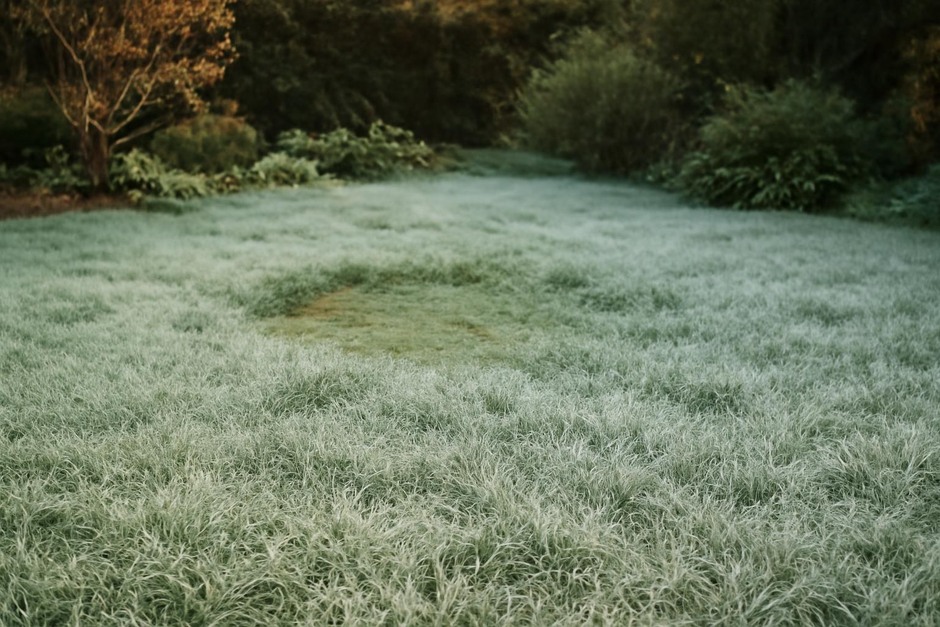
Learning Your Yard’s Frost Pockets: Five Small Experiments to Map Microclimate Risk
Late autumn and early spring are perfect times to learn which parts of a property cool fastest and hold pockets of cold air. These small, repeatable experiments build a practical skill: mapping where frost is likely to form so you can protect plants, place sensitive equipment, or simply understand local atmospheric behavior. Each exercise uses inexpensive materials and a few clear observations; together they form a simple microclimate field protocol.
Experiment 1 — Make a dawn temperature diary
Goal: Establish a baseline of the timing and magnitude of morning lows at a single location.
Materials
- A reliable outdoor thermometer (digital or analog) or a smartphone with an external sensor.
- A notebook or spreadsheet for records.
Method
- Choose a representative spot: a level, open location away from heat sources (sheds, brick walls).
- For 10–14 clear nights near the season change, record the lowest temperature you observe before sunrise and the time you record it.
- Note sky conditions (clear, partly cloudy), recent rainfall, and wind (calm, breezy).
Interpretation: Clear, calm nights usually give the lowest temperatures due to radiative cooling. This diary shows the typical morning minimum to compare with later experiments.
Experiment 2 — Vertical temperature profile
Goal: See how temperature changes with height near the ground and detect inversions or strong near-surface cooling.
Materials
- Two thermometers (or one portable sensor moved between heights).
- A 1–2 meter pole, fence post, or step ladder to mount sensors at different heights (10 cm, 50 cm, 150 cm).
Method
- On a calm, clear night, mount one thermometer ~10 cm above the ground and another at 1.5 m (head height).
- Record temperatures before sunrise at the same time for both sensors.
- Repeat across several nights and on nights with wind/cloud cover.
Interpretation: If the near-ground sensor is significantly colder than the higher one, a surface inversion is present and frost near the ground is likely. Strong inversions often occur in sheltered depressions.
Experiment 3 — Mapping horizontal variation
Goal: Find cold pockets across your property by taking sequential spot readings.
Materials
- One portable thermometer or temperature sensor.
- A simple map or sketch of your yard divided into zones.
Method
- On a clear, calm morning, walk your yard before sunrise and record the minimum temperature at multiple fixed points (low spots, under trees, near pavements, open lawn).
- Keep the measurement height consistent (e.g., 10 cm) and note surface type (grass, gravel, concrete).
- Mark the coldest spots on your map and repeat on several nights to confirm persistent patterns.
Interpretation: Low-lying areas, sheltered hollows, and places with cold, dense air pooling will show consistently lower readings. Surfaces that radiate heat quickly (open grass) can be colder than heat-retaining pavement.
Experiment 4 — A simple radiative cooling test
Goal: Separate cooling due to sky-facing radiation from cooling caused by air pooling.
Materials
- Two identical shallow metal trays or dark shallow pans.
- Two thermometers placed so they sense air temperature just above the tray surface.
Method
- Place one tray in an open spot with a clear view of the sky. Place the other under a tree or near a shelter where sky view is blocked.
- Record the tray air temperatures just before sunrise for several clear nights.
Interpretation: A larger temperature drop over the tray with open sky indicates strong radiative cooling. If both trays are equally cold, pooling or local airflow may dominate. This helps distinguish whether a site is cold because it faces the sky or because it traps cold air.
Experiment 5 — Compile and validate a frost-risk map
Goal: Combine your data to produce a practical map and test it with targeted observations.
Materials
- Your temperature diary, vertical profiles, and horizontal map.
- Markers or a digital map to annotate frost-risk zones.
Method
- Overlay repeated cold spots, strong inversions, and high radiative-loss locations. Classify areas as low, moderate, or high frost risk.
- On a predicted clear, calm night, place a few thermometers or frost-sensitive plants at representative spots to test the map’s accuracy.
- Adjust classifications based on these validation nights.
Interpretation: After a few cycles you will have a reliable, locally grounded picture of where frost forms first and most often. Use it to inform plant placement, protective covers, or when to move sensitive containers indoors.
These experiments are scalable: start with simple observation and expand to more sensors if desired. The seasonal rhythm—clear, calm nights in shoulder seasons—gives you repeatable opportunities. Over weeks you’ll turn scattered readings into a useful microclimate map, a form of practical atmospheric literacy grounded in everyday experience.