Field Notebook: What Is STEVE? Observing Subauroral Optical Emissions
Problem — The question in the field
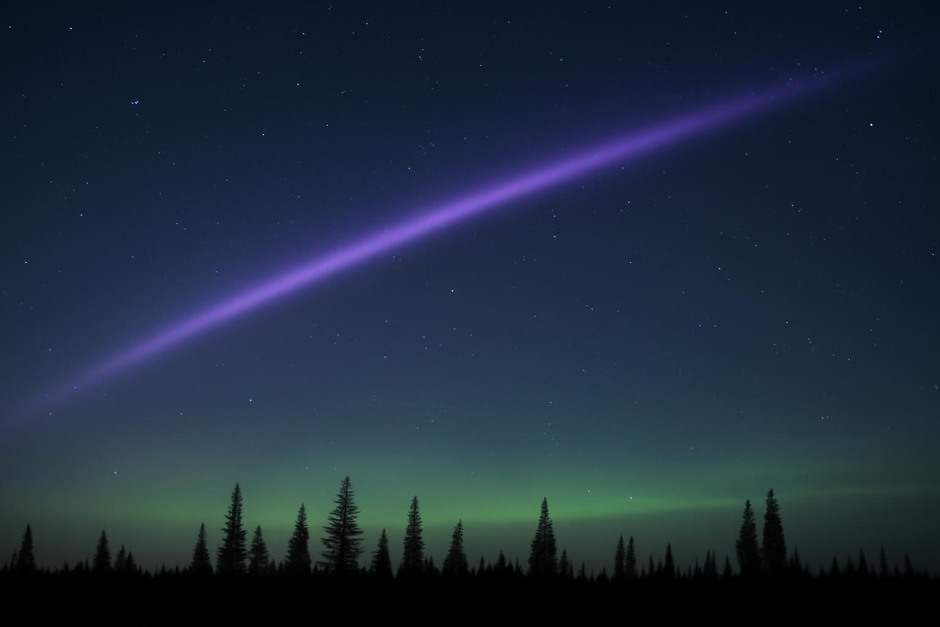
Why does the sky sometimes display a narrow, purple-pink ribbon distinct from familiar auroral curtains? Observers call this display STEVE (Strong Thermal Emission Velocity Enhancement). For photographers and researchers alike the practical questions are: when and where should you look for it, what instruments best record it, and what can field observations tell us about the physical process behind the glow?
Principles — Observational and physical guideposts
In the studio-notes spirit, I list the high-level principles that shape how we approach STEVE in the field.
1. Distinguish morphology and location
- Morphology: STEVE typically appears as a narrow, elongated arc or ribbon—often purple/pink—with an occasional green “picket fence” structure nearby. Its color and geometry differ from diffuse auroral curtains.
- Latitude: It appears at subauroral latitudes, equatorward of typical auroral ovals. This placement is a key clue to its origin.
2. Link to plasma flows rather than direct particle precipitation
Contemporary studies associate STEVE with intense subauroral ion drifts (SAIDs): narrow channels of fast-moving plasma in the upper atmosphere. Rather than the usual charged-particle precipitation that creates classical aurora, STEVE seems tied to strong electric fields and heating in subauroral regions. In practice this means coordination with magnetometer or satellite data strengthens an observation.
3. Use complementary sensors
- All-sky cameras and DSLR with wide-field lenses capture morphology.
- Spectrographs or narrow-band filters help identify emission wavelengths (purple/pink hues can arise from different excited species than the green auroral line).
- Magnetometers, GPS total electron content (TEC) data, and particle data from satellites contextualize plasma conditions.
Examples — Two short field sketches
Below I summarize two contrasting nights to show how the principles play out in practice.
Example A: The clear ribbon with picket fence
Conditions: mid-latitude field site, clear sky, moderate geomagnetic disturbance. At 21:40 local time a narrow purple arc formed low on the northern horizon. It extended east–west for several hundred kilometers, visually distinct from faint auroral curtains further north. A series of vertical green streaks—”picket fence”—formed and faded beneath the purple arc.
What we recorded: wide-field timelapse, a 1200-line spectrograph frame, and a local magnetometer trace. The magnetometer showed a transient subauroral signature consistent with a strong westward ion flow. The spectrograph lacked a dominant green 557.7 nm line typical of aurora; instead emissions clustered in shorter wavelengths and in lines associated with excited nitrogen and thermal processes.
Interpretation: morphology, co-located plasma drift signatures, and spectral differences pointed to a SAID-related emission channel plus localized particle precipitation producing the picket fence.
Example B: Purple arc without green structures
Conditions: similar latitude but weaker geomagnetic forcing. A faint purple arc appeared but without any green vertical features. The arc lingered for only 30 minutes and was narrower.
What we recorded: single camera sequence and nearby GPS-TEC data showing a brief ionospheric disturbance. No strong magnetometer spike. Spectral data were limited but suggested a weaker emission intensity overall.
Interpretation: a lower-energy SAID-like event produced a dim STEVE without concurrent particle precipitation that would form a picket fence. This highlights the variability and the need for multi-instrument context.
Review — What worked and limitations
- Combination of visual, spectral, and geomagnetic measurements provides the clearest route to linking STEVE to subauroral plasma dynamics.
- Single-camera observations can identify candidates but are insufficient to diagnose physical drivers.
- Timing coordination with satellite overpasses, when possible, yields decisive context (but is not always available in ad hoc fieldwork).
- Weather and light pollution limit reach; mid-latitude viewers must expect sporadic windows of opportunity.
Concise Practice Checklist
- Scout: identify dark horizons at subauroral latitudes and check geomagnetic indices for moderate disturbance.
- Document: set up a wide-field timelapse (ISO 800–3200, 15–30 s exposures), and run an all-sky camera if available.
- Spectra: use a simple slitless spectrograph or narrow-band filters (blue/purple and green) to separate emission colors.
- Context: record local magnetometer or magnetic declination data, and log GPS-TEC or space-weather indices when possible.
- Annotate: timestamp all files, note horizon bearings, cloud cover, and any simultaneous low-latitude aurora.
- Compare: after the session, overlay camera frames with any satellite particle/plasma data to test for SAID correlations.
Closing note: STEVE is an excellent example of how focused field practice—clear questions, small instrument suites, and systematic context—turns striking sky displays into interpretable data. Treat each observation as a hypothesis test: was this arc generated by plasma flow, particle precipitation, or a combination? Over time the accumulation of consistent, well-documented field notes refines our picture of these subauroral lights.